Predictive Factors of Satellite Conjunctions

This work was conducted as part of a final project for the Empirical Analysis course at the University of North Texas during the Fall 2024 semester. It was a privilege to collaborate with fellow PhD student, Leif Messinger, on this project. Most of the descriptions here were written for a term paper summarizing these results, which can be downloaded here. A brief video overview of this project is also available here.
Abstract
The rising quantity of objects in orbit increases the probability that conjunctions will occur, posing risks to spaceflight operations, astronaut crews, and the general public. Existing conjunction assessments rely on complex modeling of orbital dynamics that are not standardized, which is expected to become problematic as the number of spaceflight operators continues to grow. Our work explores alternative methods for predicting conjunctions using features extracted from publicly available satellite data. The results show how synchronization time is a significant predictor of the probability of collision between satellite pairs.
Introduction
The United States Space Command (USSPACECOM) provides public access to satellite data via Space-Track [1], including details like the country of origin and telemetry information of different objects in orbit. This data is essential for estimating whether orbital fluctuations reduce the distance between satellites (i.e., conjunctions) such that collisions are possible.
Background
The number of objects in orbit increased significantly since 2018 and is expected to continue rising [2], [3]. Consequently, the number of collisions that generate space debris is also expected to increase [2], potentially introducing new safety and operational hazards to humans working aboard space stations and to the general public on the ground. Existing techniques for assessing these kinds of risks emerged in 1986 after the Space Shuttle Challenger accident, and are described in a handbook released by the National Aeronautics and Space Administration (NASA) in 2020 [3]. The handbook offers guidance for assessing the risks associated with closely orbiting objects (i.e., conjunction assessment). A comprehensive guide for conjunction assessment is offered by USSPACECOM [4].
Conjunction Assessment
In general, conjunction assessment relies on extensive catalogs of orbiting objects, such as the U.S. Space Surveillance Network (SSN), to track orbital fluctuations and predicting close approaches [4]. This process involves daily screening of object positions (i.e., ephemeris), conducting risk assessments, and reporting via a Conjunction Data Message (CDM) when the probability of collision (PC) meets or exceeds a threshold. Objects in Low Earth Orbit, for example, are reported when the PC is greater than or equal to 0.0009. The resulting data are shared with operators in standard formats to allow operators to enact collision avoidance maneuvers when necessary.
Two Line Element (TLE)
Two Line Elements (TLEs) provide telemetry information used to predict satellite orbits. Data includes an identifier, current time (epoch) in days and years, mean motion with first and second derivatives, BSTAR (drag), inclination, right ascension of the node, eccentricity, argument of perigee, mean anomaly, mean motion, and the total revolutions made by the body [5]. This data offers information about the satellite’s history and orbit path. TLEs are currently the most common format for tracking satellites larger than ∼ 10 cm. A variety of software libraries, such as PyEphem, can parse TLE entries and such that satellite positions can be calculated.
Methodology
We use statistical modeling, astrophysics software libraries, and open source APIs to identify relationships between variables in publicly available satellite data. The goal of this work is to inform the creation of models that may be used to predict PC scores in a more streamlined and accessible manner than existing methods. We anticipate that the factors leading to conjunctions will be easily extracted from publicly available satellite data.
Though existing methods for predicting conjunctions are expected to be highly accurate, they were not originally designed for assessing the risk of conjunctions [3]. We apply a utilitarian ethic in this work, as we hope to modernize this process for the benefit of a wide range of stakeholders and contribute to the democratization of methods used to conduct conjunction assessments.
- Research Question: Are easily obtained features of satellites useful predictors of the probability of collision?
- Hypothesis: Country of origin and object type can predict the probability of collision.
![Fig. 1. Orbit plots for the pair of objects with the highest PC score in the dataset. The legend denotes the satellite ID for each object. These plots are modified versions of examples found online [6].](https://cdn.sanity.io/images/e0dgbgo1/production/dfce32dbd74e56af336234c66164c9c5b108b68e-1081x775.png?w=3840&q=75&fit=clip&auto=format)
Data collection
Satellite conjunction data was obtained using the space- track REST API. Each row of the dataset features the probability of collision (PC) score associated with pairs of objects in orbit. Object types include debris, rocket bodies, payloads, and unknown objects. Satellite names from the conjunction report were used to obtain TLE sets for each object by querying the N2YO REST API [7] with a Python script. The TLEs allowed us to calculate the approximate position of each object within a limited time frame and plot their orbits using Matplotlib and example code found online [6].
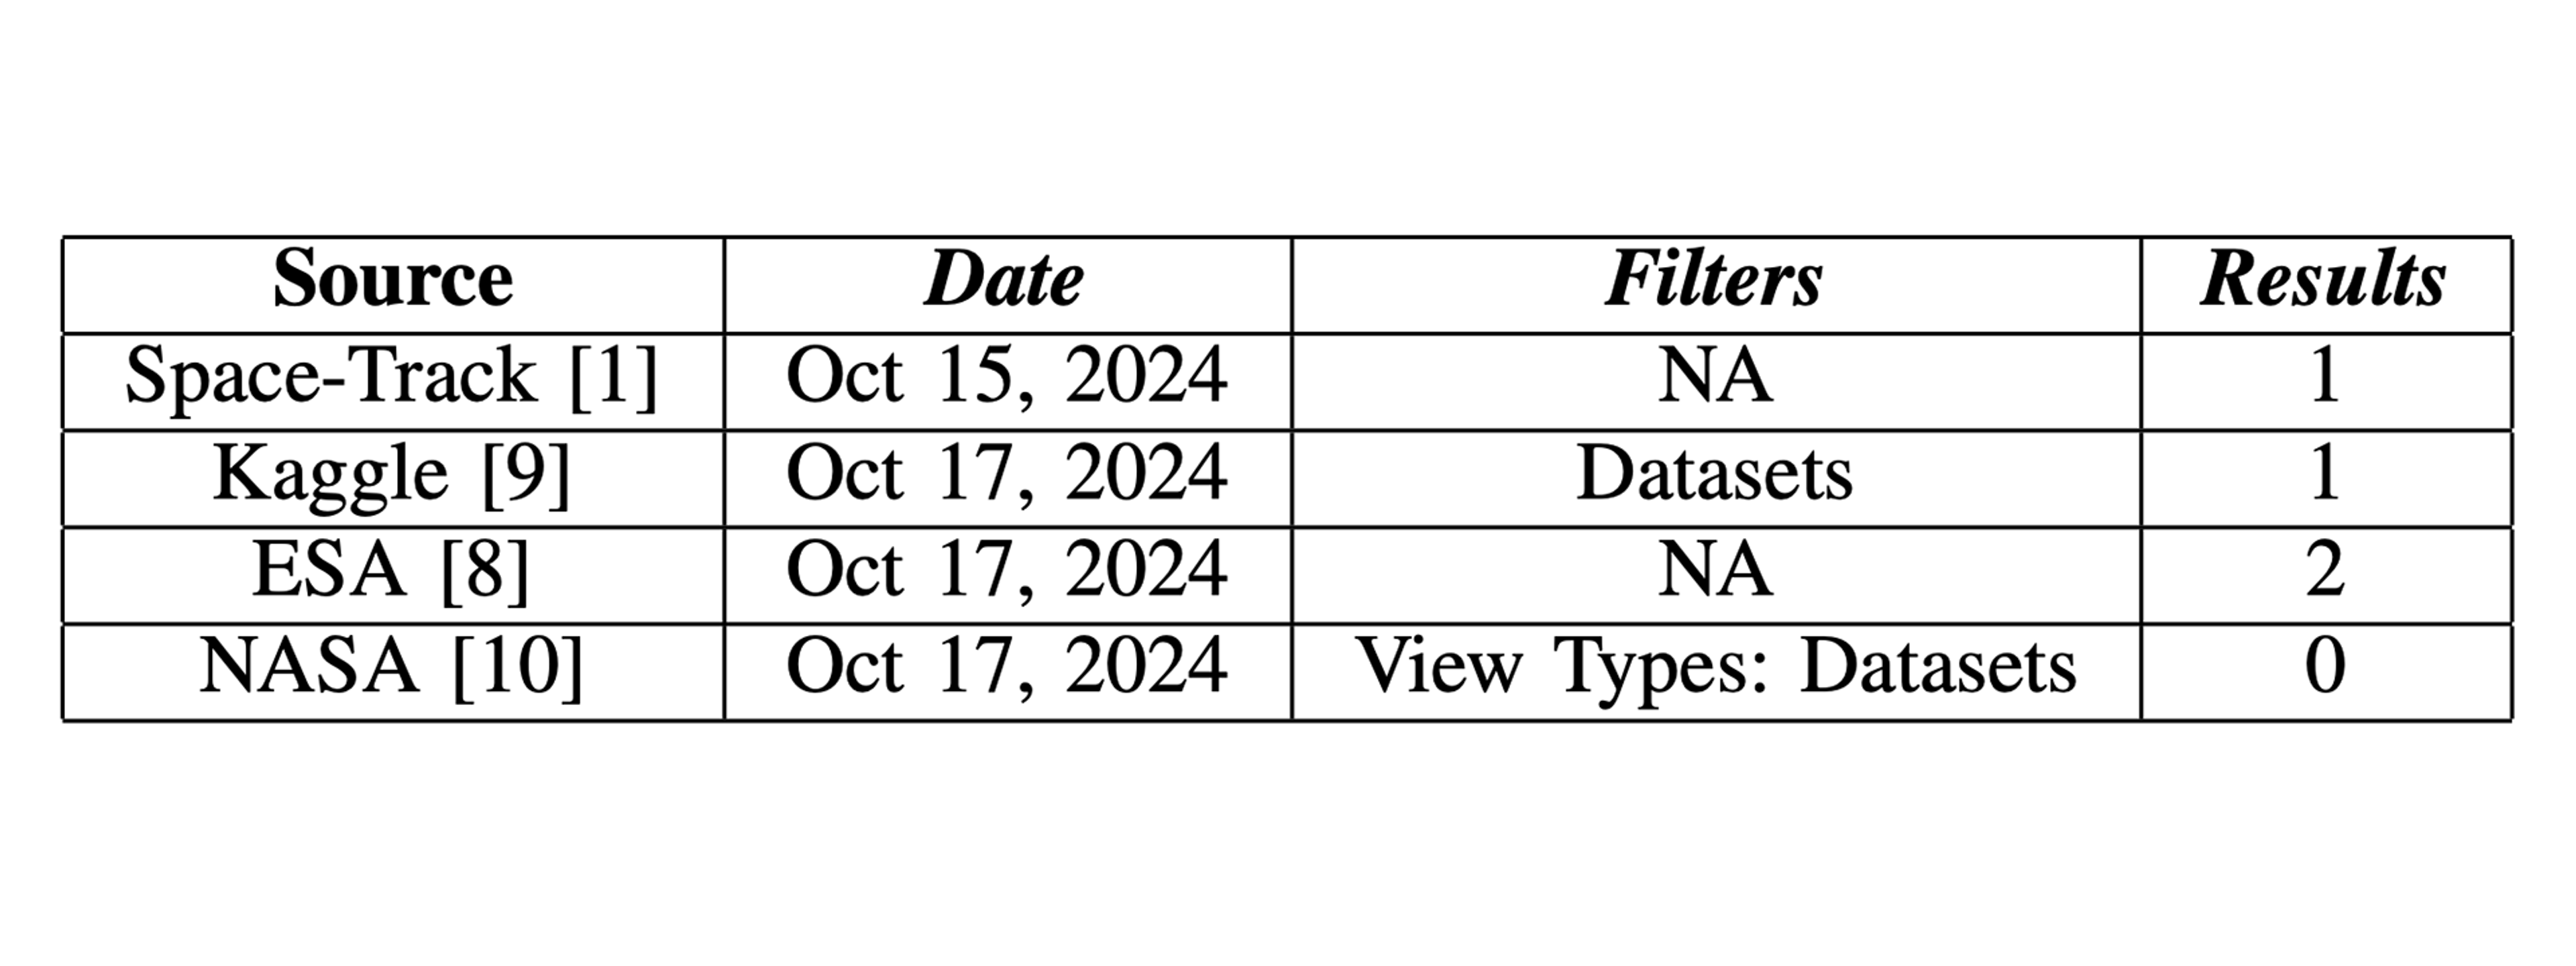
We searched for additional conjunction datasets on Kaggle and NASA’s Open Data Portal using the keywords satellite AND (conjunction OR conjunction analysis). With the exception of datasets derived from a competition sponsored by the European Space Agency (ESA) in 2020 [8], few other relevant datasets were identified in our search (Table 1). The retrieved datasets were processed using standard analysis and visualization libraries, including Pandas, NumPy, Scikit-learn, Matplotlib, and Seaborn. All project code is stored in a GitHub repository.
Data analysis
Exploratory data analysis (EDA)
We conducted an exploratory data analysis (EDA) to identify the countries associated with highest-risk satellite pairs in the conjunction report. While the conjunction report does not explicitly name the countries of origin for each satellite, the space-track API features a box score dataset that displays the total count of orbital object types and their associated countries. We used the box score dataset to infer countries of origin without manually pairing each satellite name with its respective country, although such pairing would be necessary if country of origin relates to PC scores in a meaningful way.
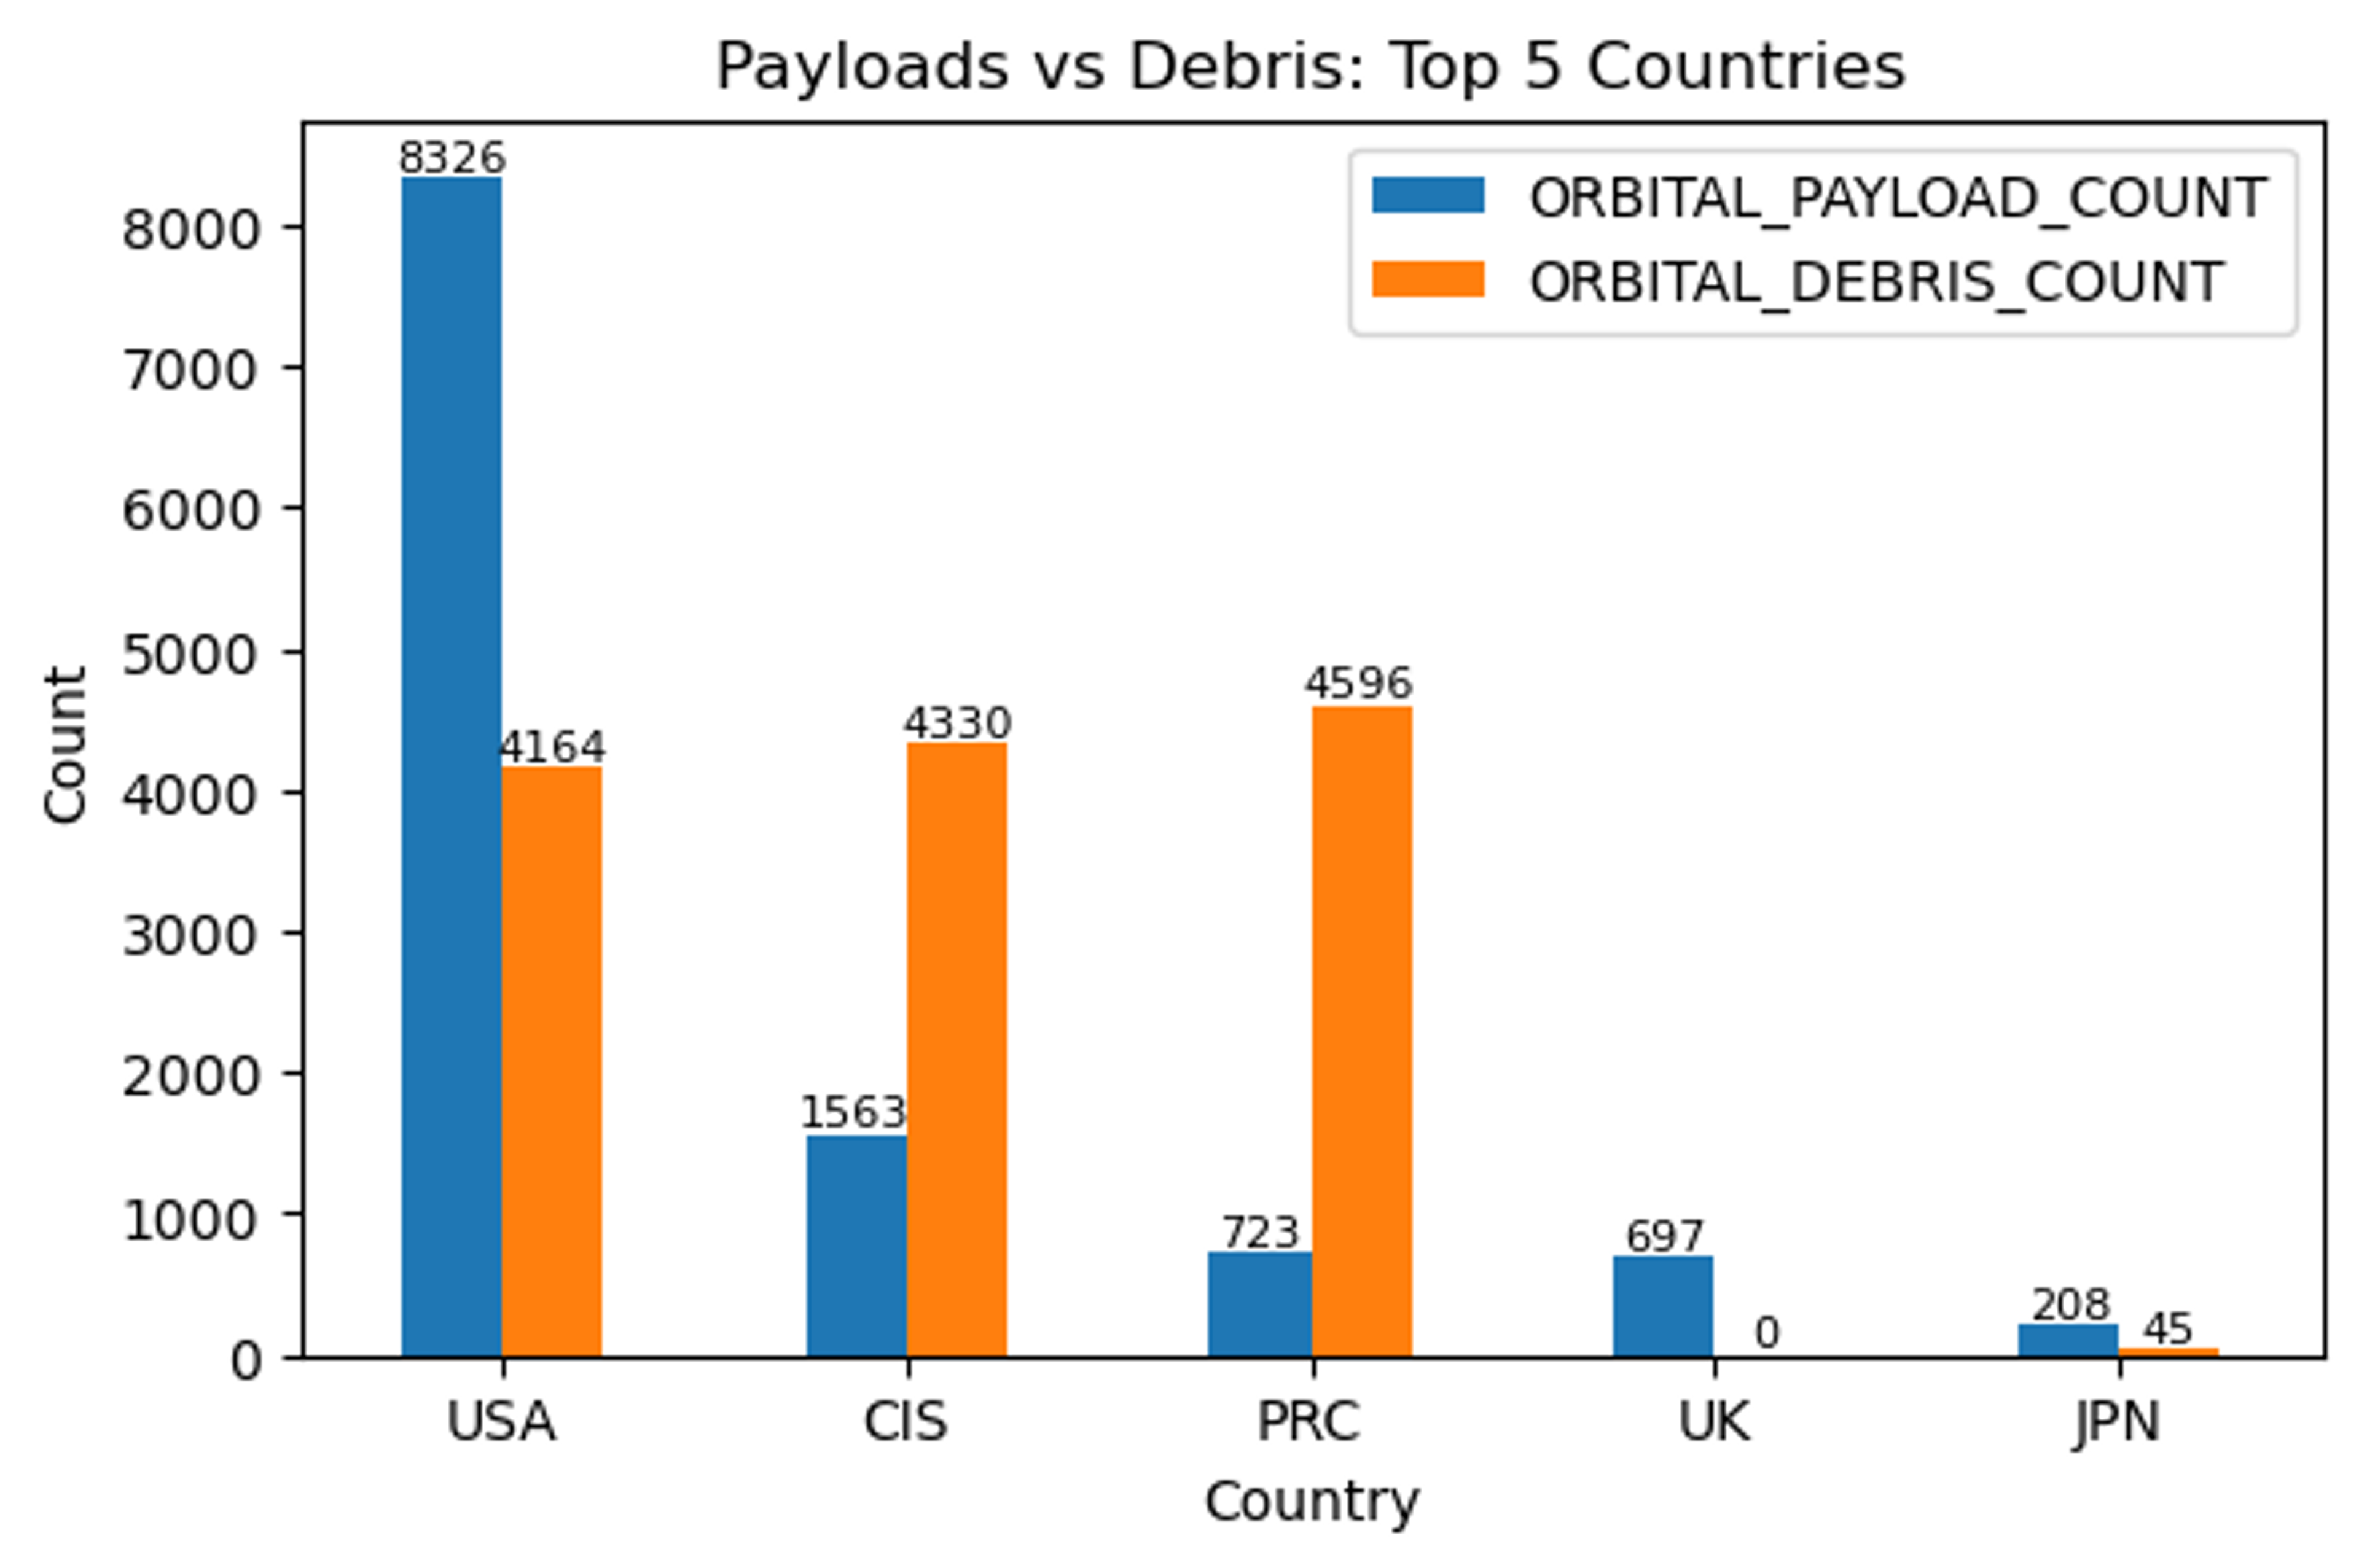
Of all objects known to be in orbit, 13,614 are debris, 13,117 are payloads, and 2,353 are rocket bodies. The United States (USA), Russia (CIS), and China (PRC) are each associated with similar amounts of orbital debris (M = 4363.33, SD = 217.92). The USA is responsible for approximately half as many debris as payloads, whereas Russia and China are each responsible for more than twice as many debris as payloads (Fig. 2).
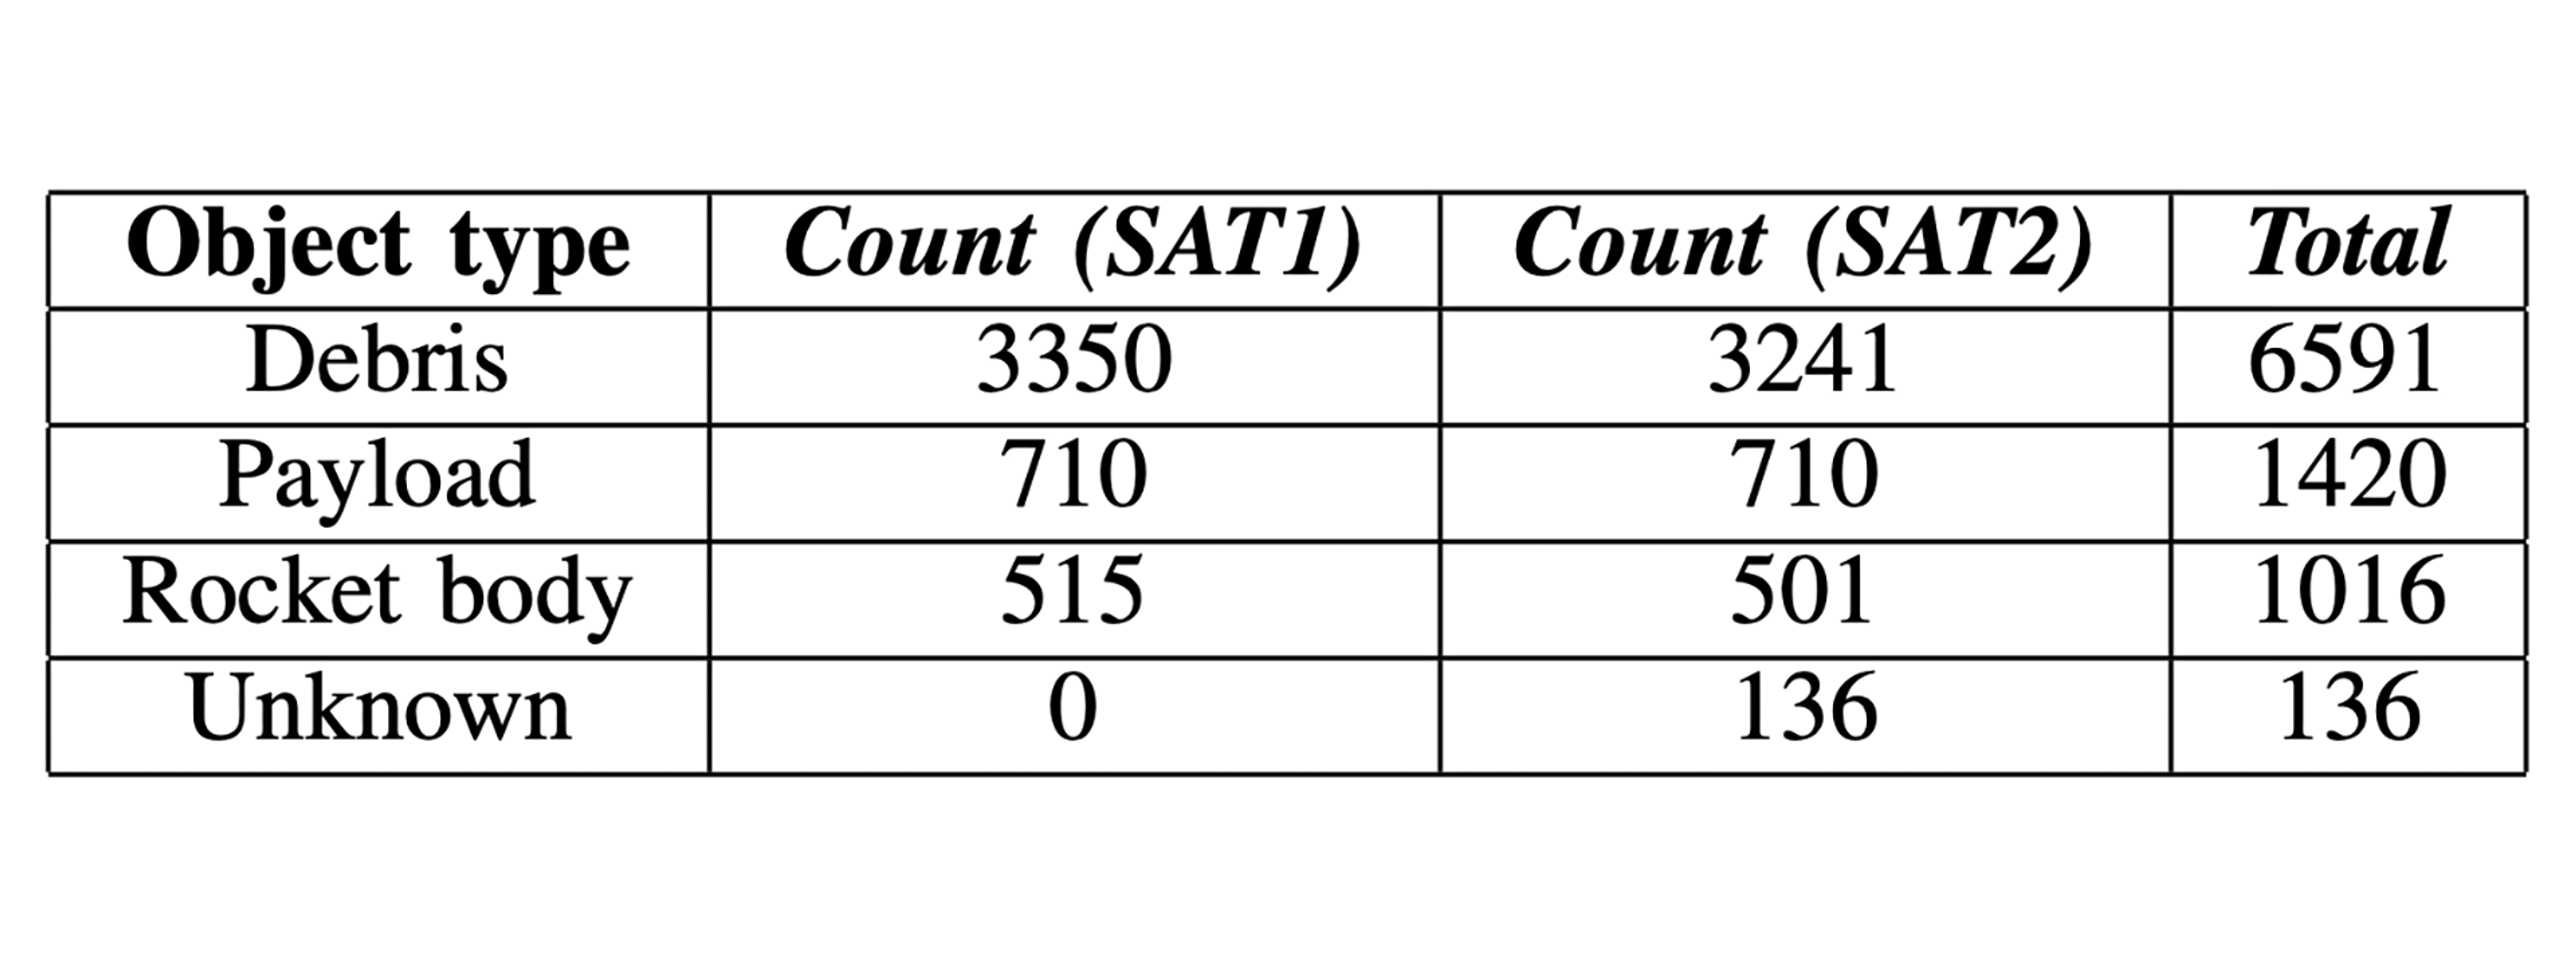
We then analyzed the object types in the conjunction report to better understand the qualities of satellite pairs in the conjunction report. Approximately 72% of all objects with a probability of collision greater than 0 are debris (Table 2).
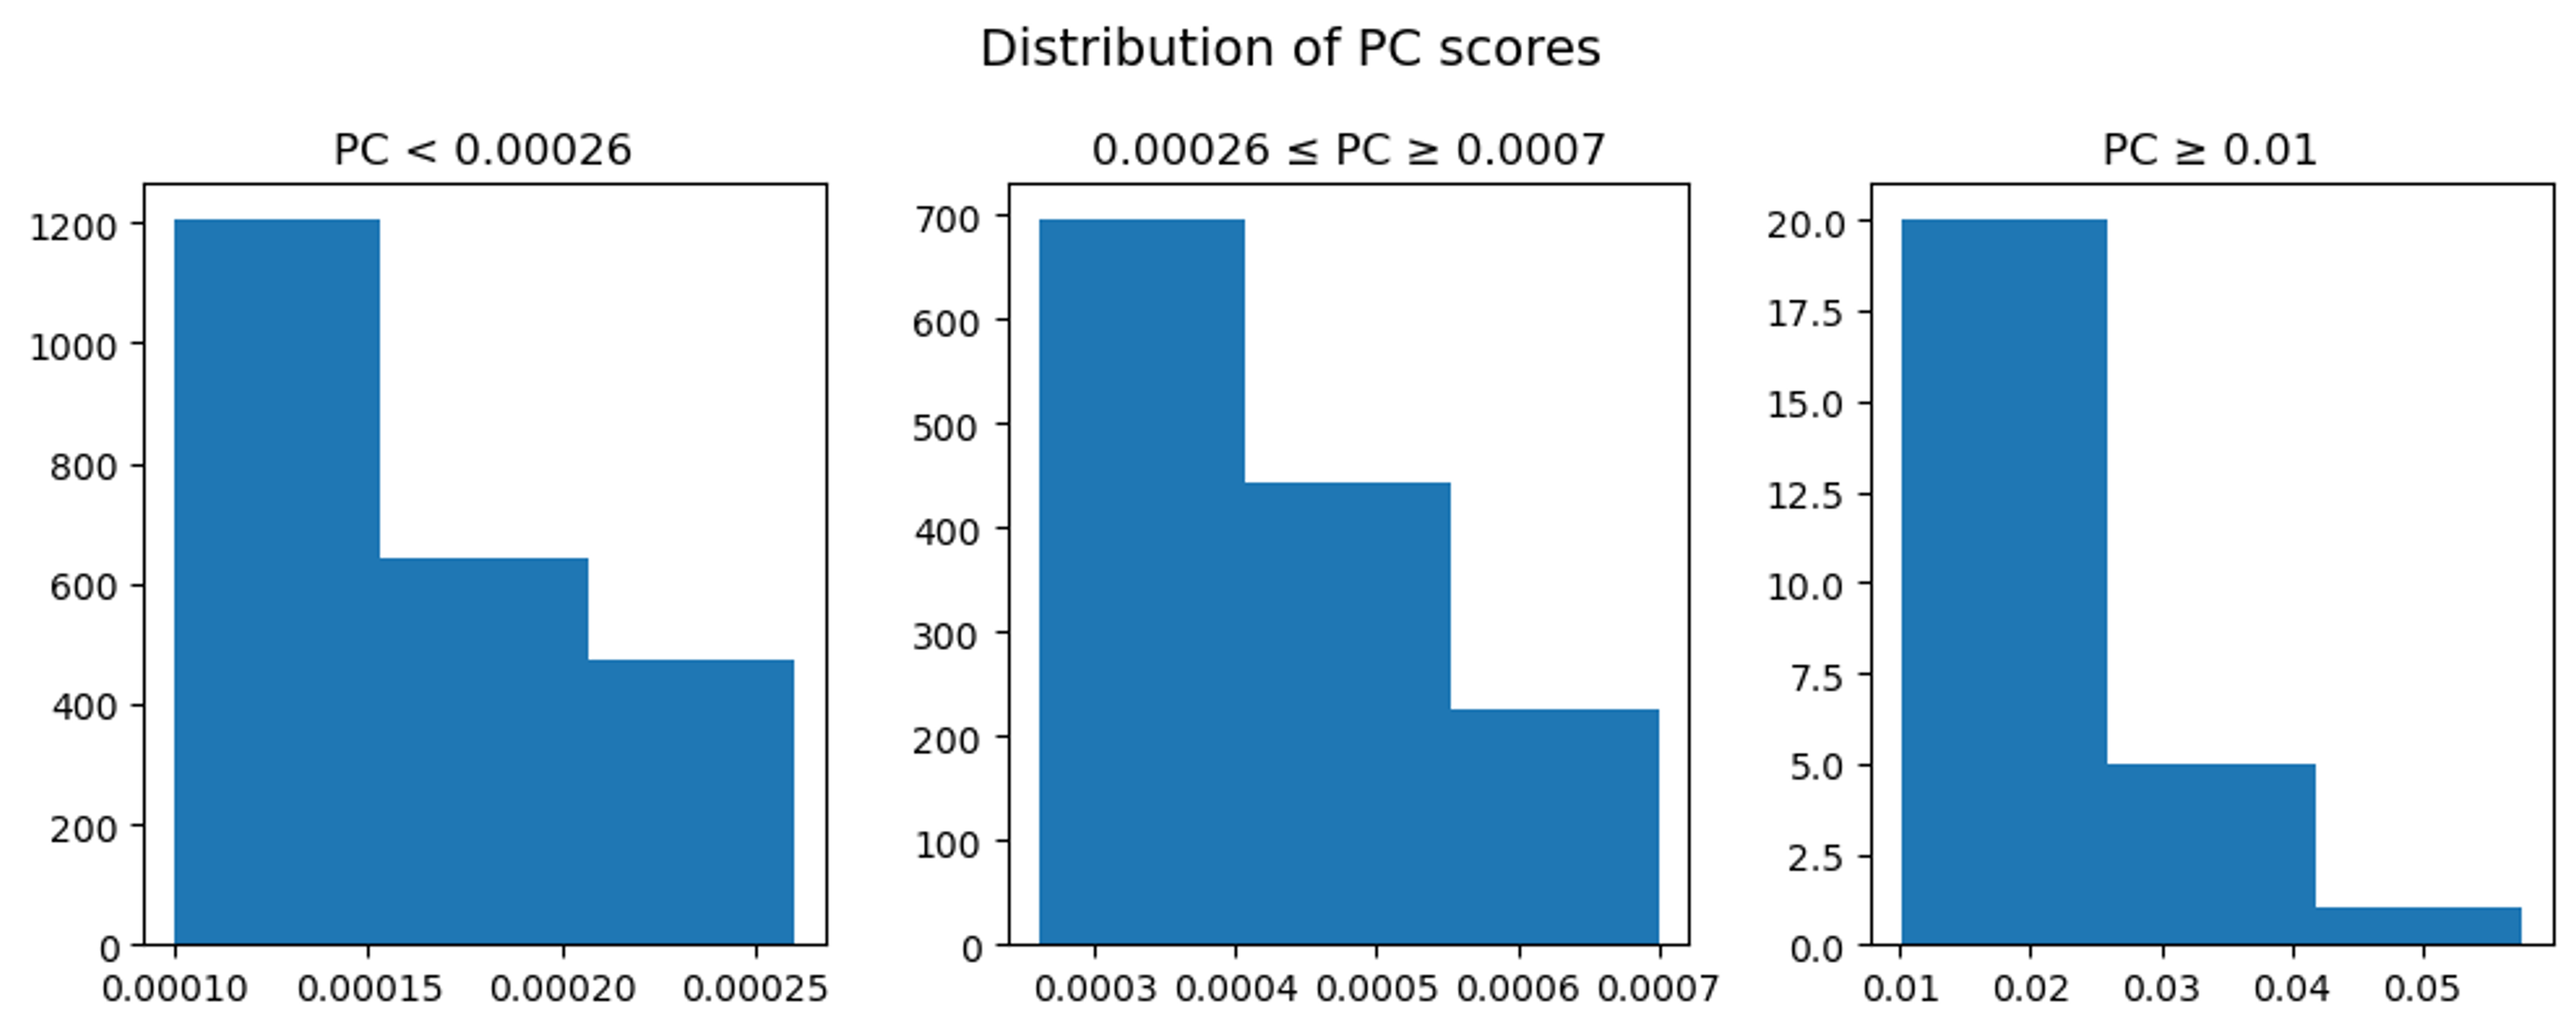
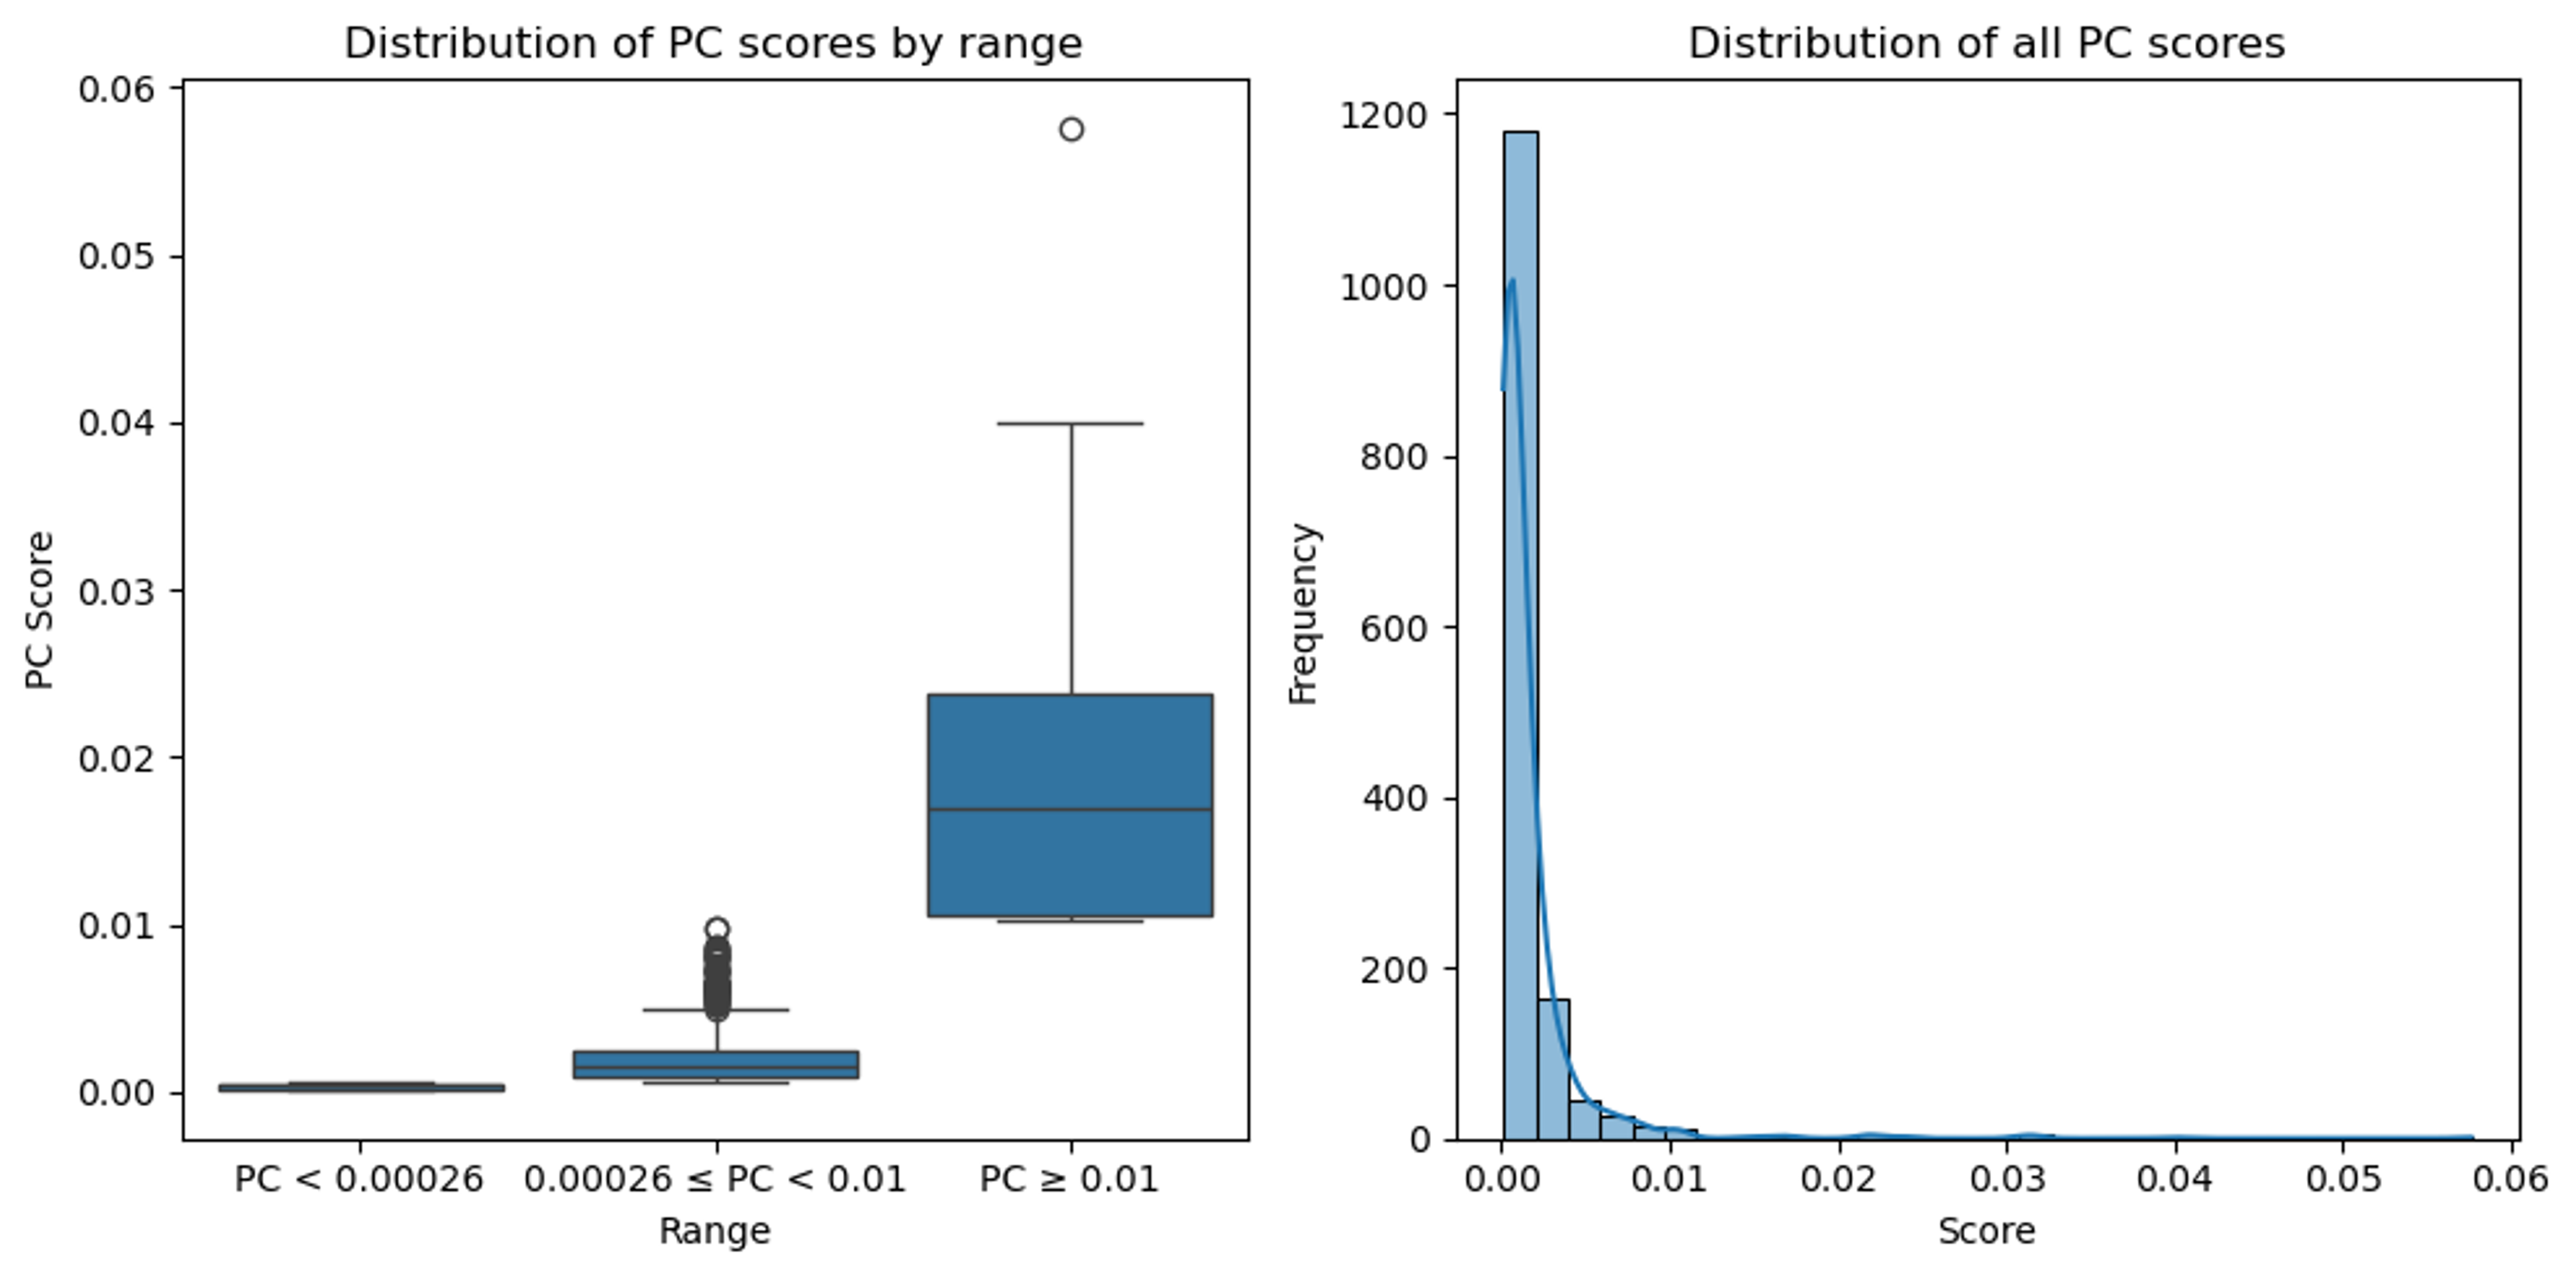
The mean and median PC scores are 0.0007 and 0.00026 (SD = 0.00197), respectively, indicating that most objects in the dataset have a PC of 0.00026 or lower (Fig. 3). The pairs of objects with both the highest (0.06) and lowest (0.0001) PC scores are fragments from a CZ-6A rocket body belonging to the People’s Republic of China (PRC).
Linear Regression Analysis
The Spaceflight Safety Handbook for Satellite Operators notes how object sizes are factored into PC calculations to inform the creation of a conjunction plane [4, p. 46]. We used linear regression analysis to examine correlations between object types and the PC score for each object pair in the dataset to see if this feature could be extracted. There is a slight slope visible in the regression analysis, indicating that object type is somewhat correlated with collision probability (Fig. 4).
Given that most of the objects in the conjunction dataset are debris, we expected a stronger correlation to exist between object type and PC score. These results suggest that object type alone may not be a useful predictor of PC scores or, by extension, the actual likelihood a satellite may experience a conjunction.
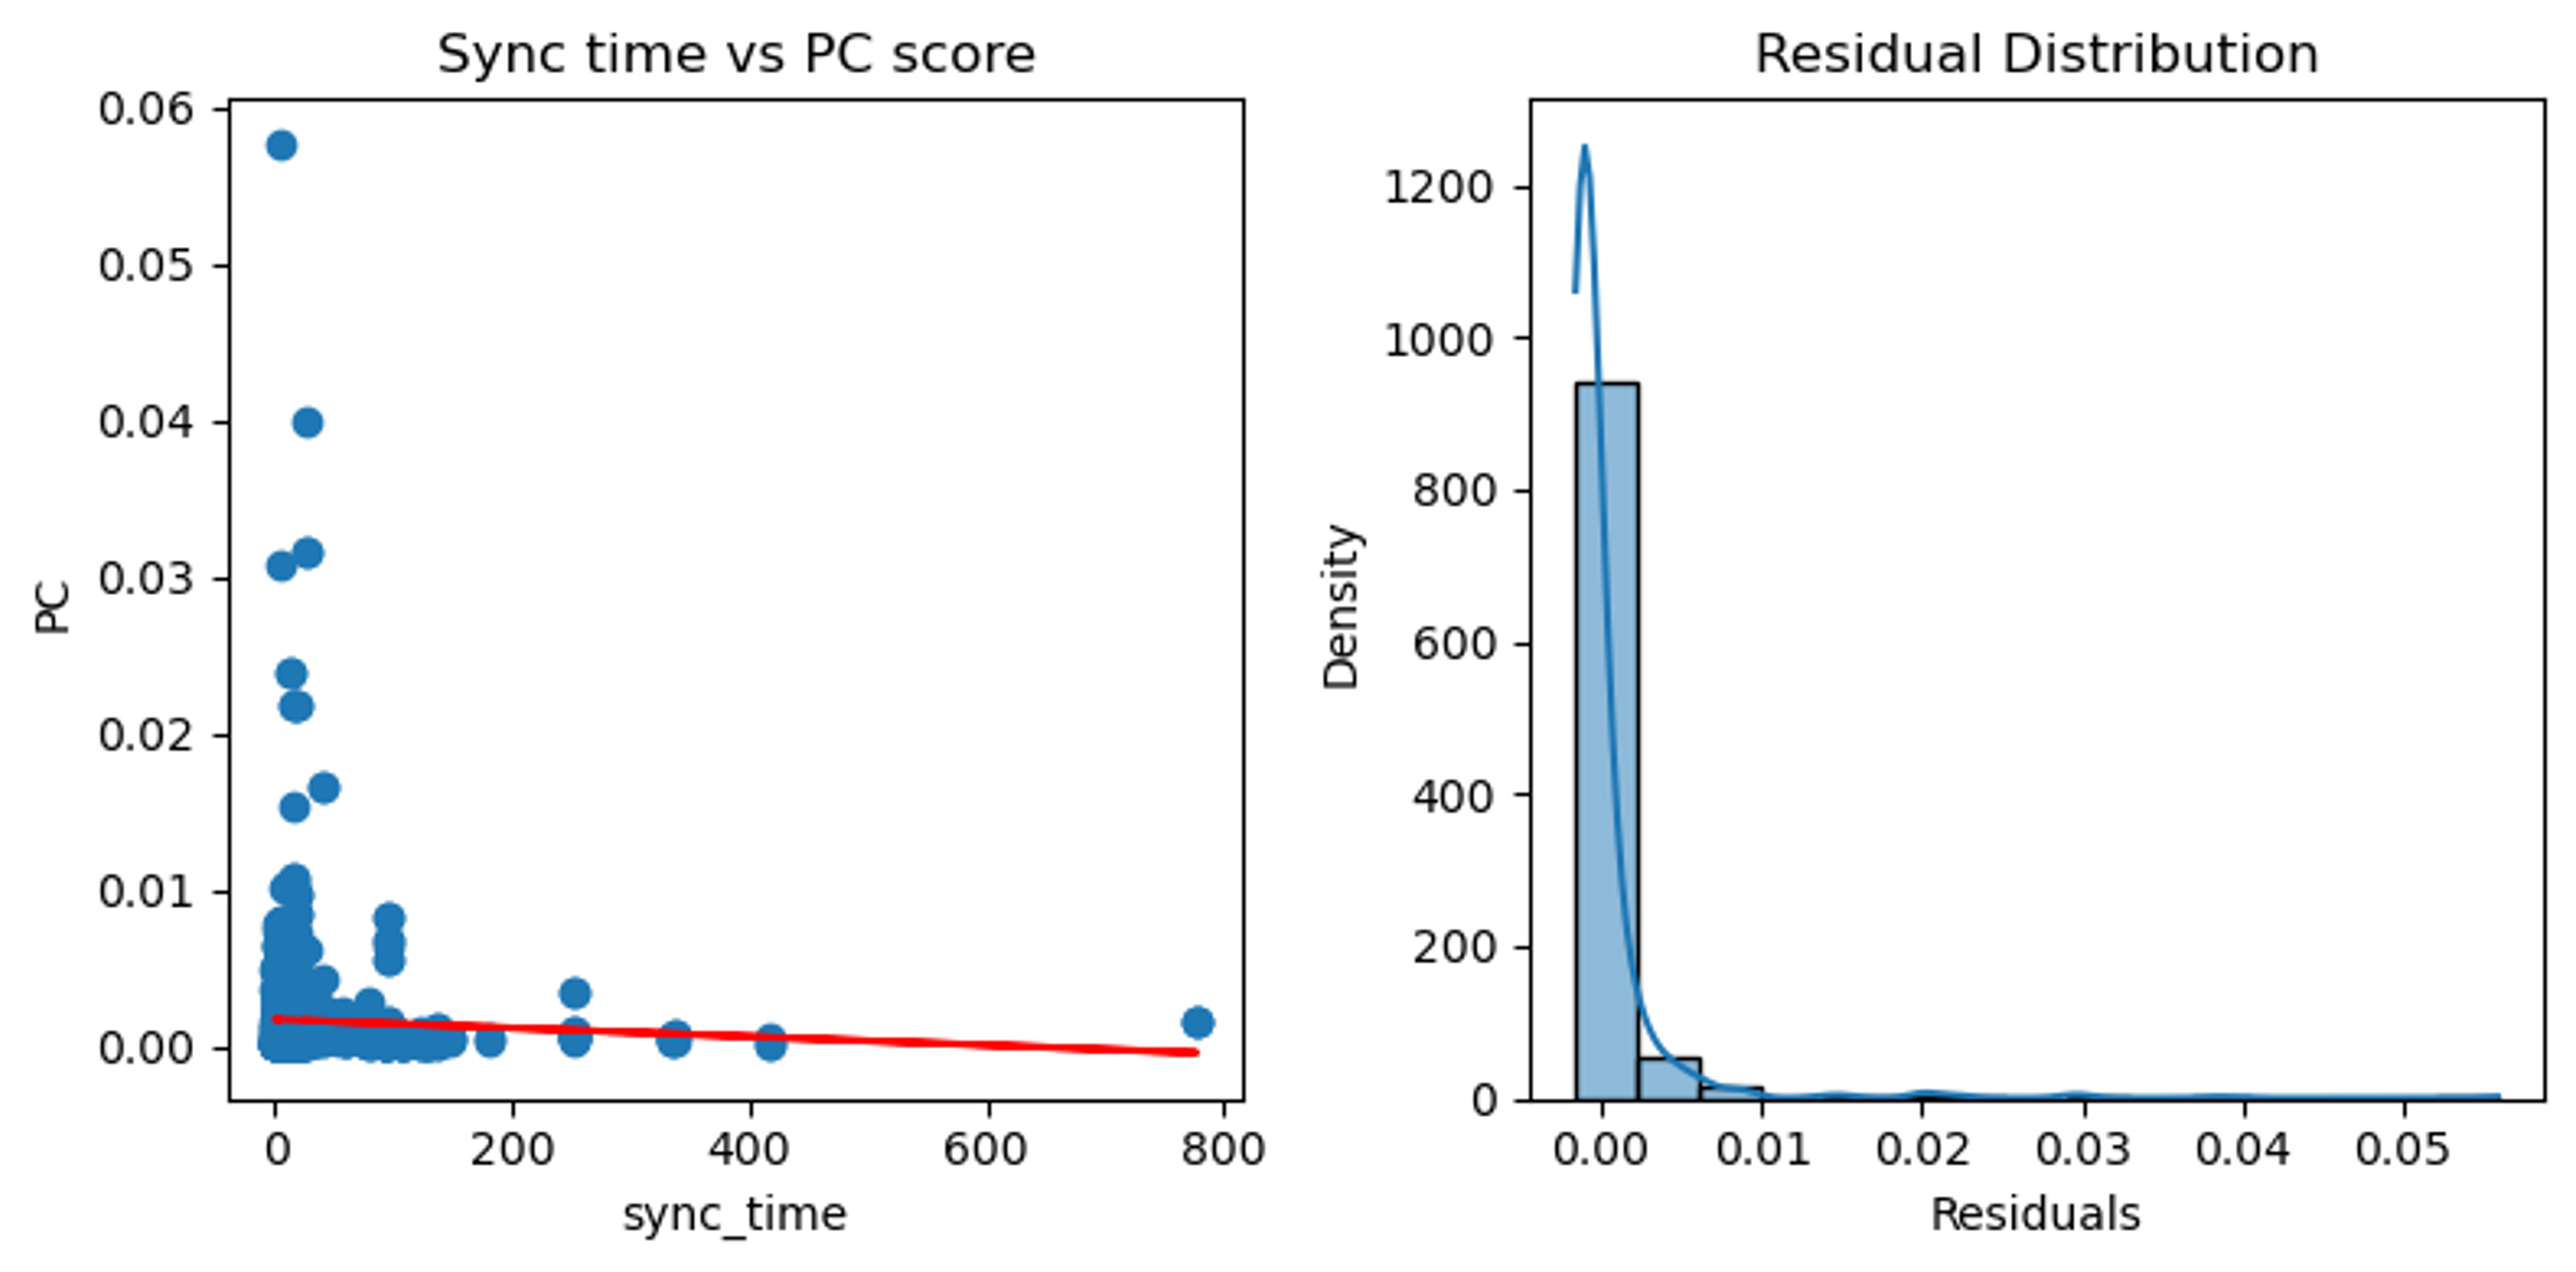
Linear regression was also used to determine if relationships exist between PC and variables not present in the dataset. Specifically, we compared PC scores with the amount of time the orbits of two objects are synchronized. In other words, we assumed that if two satellites orbit in close proximity to one another, their risk of collision may be lower when their orbits are synchronized and higher when their orbits are not synchronized.
Sync times were determined using the TLE for 1,460 satellite pairs in our conjunction dataset, allowing us to calculate orbital periods for each satellite pair using PyEphem [11] and estimate the amount of time orbits are synchronized. We hypothesized that higher sync times correlate with lower PC scores and vice versa.
When two satellites share the exact same orbit and orbital period, they face virtually no risk of collision. However, when the orbital period varies, the orbits are desynchronized and the satellites face a higher risk of collision. In our exploratory data analysis, we found that satellite pairs with the highest PC have low sync times, whereas those with the lowest PC have high sync times. We describe sync time as the time required for two orbital frequencies to synchronize, where f1 and f2 are the frequencies of two satellites.
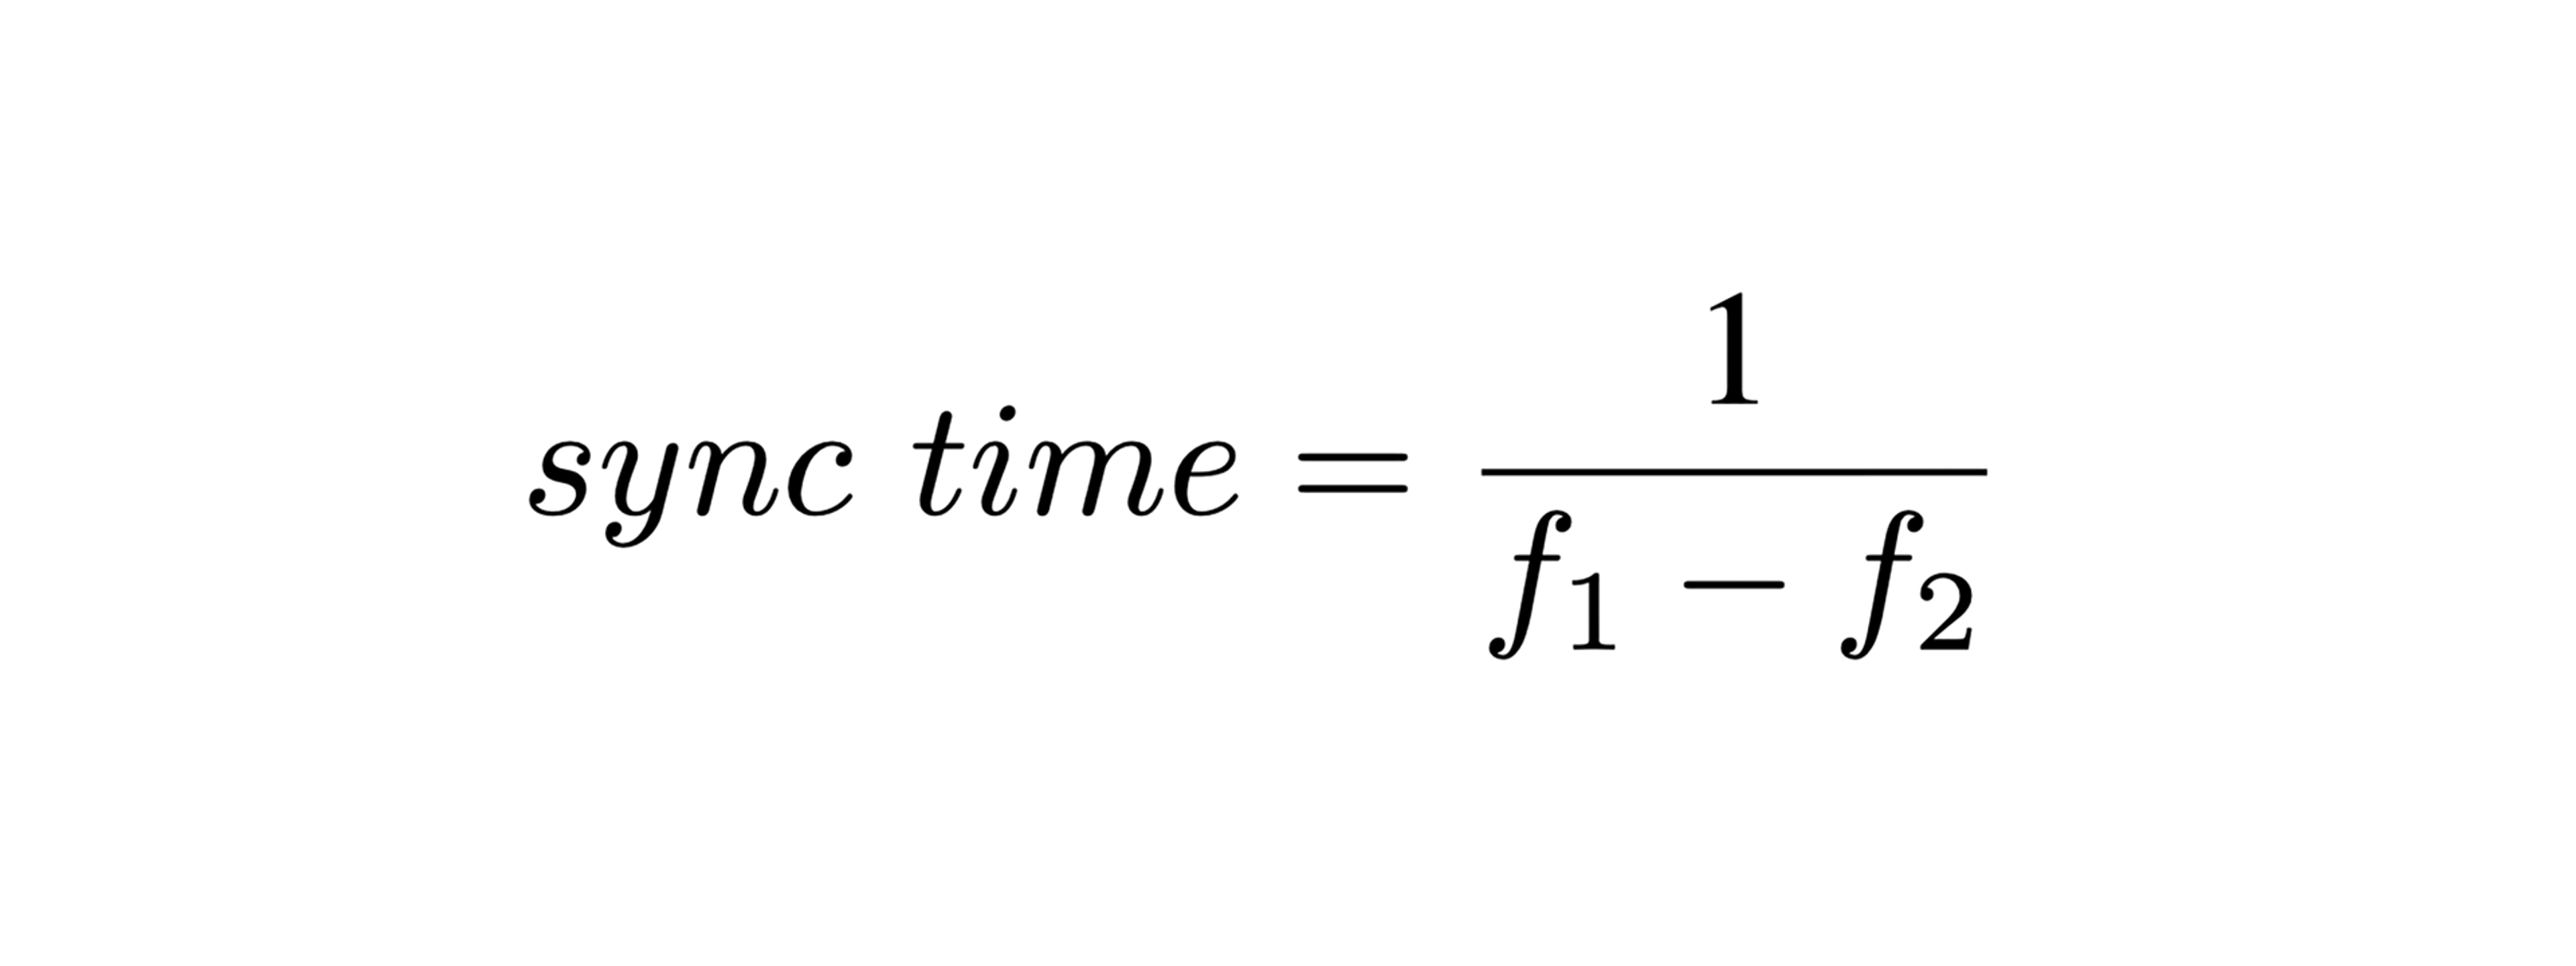
In the conjunctions dataset, the frequency is provided by the satellite’s TLE as mean motion. Angular speed is calculated using revolutions per day. In circumstances where satellites share similar orbits and their orbital periods are not synchronized, it is reasonable to assume that they are more likely to collide and should have higher PC scores.
This formula can also be used if frequency is unavailable and only the orbital period is known. In such cases, the inverse of the period can be used to determine frequency. Since we compute the inverse difference of two frequencies for use in machine learning (ML), this detail is not expected to be problematic. Models should be able to extrapolate sync time from a difference in either period or frequency. Similar frequencies will have similar periods, and dissimilar frequencies will have dissimilar periods.
Linear regression analysis indicates that sync time has some impact on PC scores. However, there appears to be a fairly nonlinear relationship between PC scores and sync time. The majority of scores fall below the average score (∼ 0.0007) and small clusters of outlier PC scores exist at the high and low ends of the range. Both of these factors are likely modulating the regression coefficient. These results suggest that linear regression may not be a useful method for predicting the likelihood a satellite may experience a conjunction.
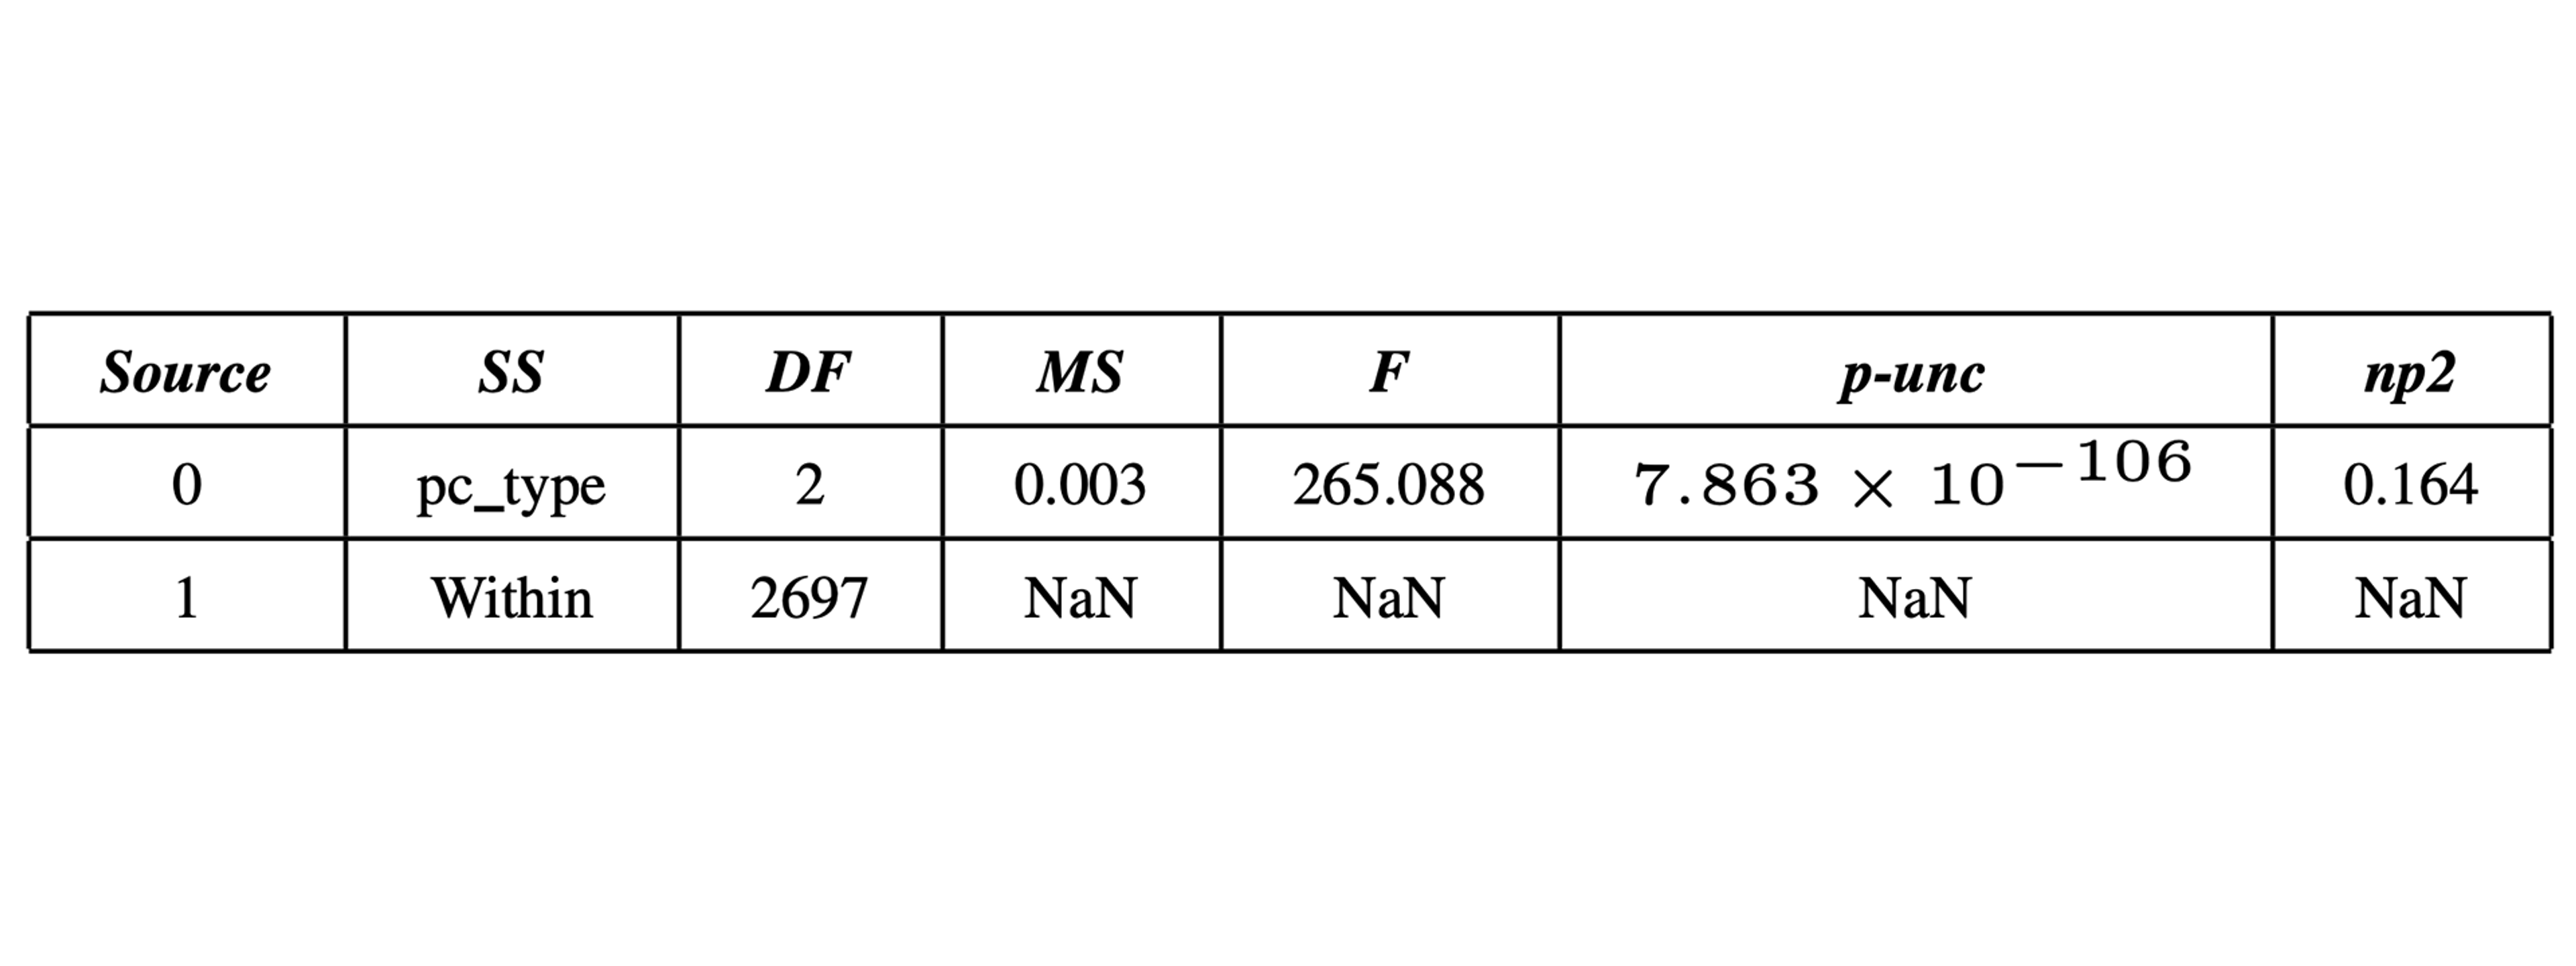
Analysis of Variance (ANOVA)
We conducted ANOVA twice to identify the extent of variations between groups with low, average, and high PC scores relative to sync time. In the first ANOVA, we examined equal distributions of scores that are below average, average, or above average. In the second ANOVA (Table 3), we specified the low, average, and high ranges based on the distribution of PC scores in the dataset (Figure 5). In both cases, the resulting p-values (p < 1×10−100) are much lower than 0.05, indicating highly statistically significant differences between groups.
Limitations and future work
Since there are currently no documented cases of injury caused by space debris returning to Earth, it could be argued that the safety risks of conjunctions may be minimal for the general public [12]. It is unclear if this trend is expected to persist as the number of objects in orbit continues to surge.
Since TLE pairs are only accurate for several weeks, long simulations spanning months or years may not give precise results. This limitation might be overcome by comparing older TLE pairs with newer TLE pairs to evaluate the extent to which the orbits change. If a satellite has a more predictable orbit, it may also have a lower PC.
Our work relies on publicly available data provided by USSPACECOM, which may not include details of objects managed by other countries. The extent to which PC estimates vary between governmental space programs and commercial operators was not immediately clear to us. As such, predictive models trained using this data may reflect a bias towards objects tracked by the United States. Future work for PC estimation should account for variances that may exist between scoring methods and available data.
We demonstrated how since sync time appears to be a strong predictor of PC scores. Future work could use sync time to train different machine learning (ML) models for PC prediction and compare the accuracy with existing methods used to calculate the probability of collision. Additionally, satellites rotating in the same direction should have conjunctions half as frequently as satellites moving in the same direction. Exploring the impact of orbital direction on PC may further improve PC predictions.
Conclusion
Investigating features that are strong indicators of potential collisions could help identify more satellite pairs that are likely to collide, as well as the causes of potential collisions. Our ANOVA test demonstrates how the sync time between satellite orbits is a significant factor in calculating the probability of collision, showing promise as a feature that may inform the creation of more advanced models of PC estimation.
Most objects with a probability of collision greater than 0 are space debris. While the USA is more efficient (orbital payloads / orbital debris) than other space programs and commercial entities, it still generates a similar amount of debris. Legislation could be passed to ensure government organizations and commercial operators are more mindful of what is sent into space.
As the number of satellites in orbit continues to rise, accurate predictions of conjunctions will become increasingly vital for securing the safety of humans working in space, as well as those on the ground. Identifying the factors leading to conjunctions is paramount to developing accurate conjunction assessments and mitigating the risks posed by the increasing number of satellites in orbit.
References
- Space-Track.org. [Online]. Available: https://www.space-track.org/documentation#/odr (visited on 10/16/2024).
- H. G. Lewis and G. Skelton, “Safety considerations for large constellations of satellites,” Journal of Space Safety Engineering, Aug. 2024, [Online; accessed 2024- 10-16], ISSN: 2468-8967. DOI: 10.1016/j.jsse.2024.08.001. [Online]. Available: https://www.sciencedirect.com/science/article/pii/S2468896724001150.
- NASA Spacecraft Conjunction Assessment and Collision Avoidance Best Practices Handbook, Feb. 2023. [Online]. Available: https://nodis3.gsfc.nasa.gov/ OCE docs/OCE 51.pdf.
- Spaceflight Safety Handbook for Satellite Operators, Apr. 2023. [Online]. Available: https://www.space-track.org/documents/SFS Handbook For Operators V1.7.pdf.
- D. A. Vallado and P. J. Cefola, “Iac-12-A6.6.11 TWO- LINE ELEMENT SETS – PRACTICE AND USE,”
- RP, Plot Satellites’ Real-time Orbits with Python’s Matplotlib — In Plain English, en-GB, Nov. 2023. [Online]. Available: https://plainenglish.io/blog/plot-satellites-real-time-orbits-with-python-s-matplotlib (visited on 12/04/2024).
- N2YO.com API, https://www.n2yo.com/api/, [Online; accessed 2024-11-25]. [Online]. Available: https://www.n2yo.com/api/.
- Kelvins Collision Avoidance Challenge Data, https://kelvins.esa.int/collision-avoidance-challenge/data/, [Online; accessed 2024-11-25]. [Online]. Available: https://kelvins.esa.int/collision-avoidance-challenge/data/.
- Collision Avoidance Challenge, [Online; accessed 2024-
11-25]. [Online]. Available: https://www.kaggle.com/datasets/shadmanrohan/collisionavoidancechallenge. - NASA Open Data Portal, https://data.nasa.gov/, [Online; accessed 2024-11-25]. [Online]. Available: https://data.nasa.gov/.
- PyEphem Home Page, https://rhodesmill.org/pyephem/,
[Online; accessed 2024-11-28]. [Online]. Available:
https://rhodesmill.org/pyephem/. - ARES — Orbital Debris Program Office — Frequently Asked Questions. [Online]. Available: https://orbitaldebris.jsc.nasa.gov/faq/ (visited on 12/01/2024).

